

What is a BCG Growth-Share Matrix?
The Boston Consulting Group (BCG) growth-share matrix is a planning tool that uses graphical representations of a company’s products and services to help the company decide what it should keep, sell, or invest more in.
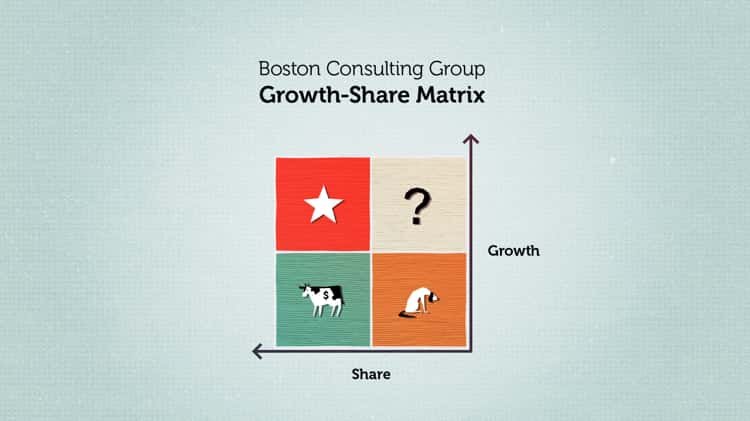
The matrix plots a company’s offerings in a four-square matrix, with the y-axis representing the rate of market growth and the x-axis representing market share. The Boston Consulting Group first introduced it in 1970. 1
Understanding a BCG Growth-Share Matrix
The BCG growth-share matrix breaks down products into four categories: dogs, cash cows, stars, and question marks. Each category quadrant has its own set of unique characteristics.
Dogs (or Pets)
If a company’s product has a low market share and is at a low growth rate, it is considered a dog and should be sold, liquidated, or repositioned. Dogs in the lower right quadrant of the grid don’t generate much cash for the company since they have a low market share and little to no growth. Because of this, dogs can turn out to be cash traps, tying up company funds for long periods. For this reason, they are prime candidates for divestiture.
Cash Cows
Products in low-growth areas but for which the company has a relatively large market share are considered cash cows, and the company should thus milk the cash cow for as long as it can. Cash cows in the lower left quadrant are typically leading products in mature markets.
These products generate higher returns than the market’s growth rate and sustain itself from a cash flow perspective. These products should be taken advantage of for as long as possible. The value of cash cows can be easily calculated since their cash flow patterns are highly predictable. In effect, low-growth, high-share cash cows should be milked for cash to reinvest in high-growth, high-share stars with high potential.
Stars
Products in high-growth markets that make up a sizable portion of that market are considered stars and should be invested in more. In the upper left quadrant are stars, which generate high income but consume large amounts of company cash. If a star can remain a market leader, it eventually becomes a cash cow when the market’s overall growth rate declines.
Question Marks
Questionable opportunities exist in high-growth markets where the company does not maintain a significant market share. Question marks are in the upper right portion of the grid. They typically grow fast but consume large amounts of company resources. Products in this quadrant should be analyzed frequently and closely to see if they are worth maintaining.
Limitations of the Matrix
One thing to note is that the matrix is a decision-making tool. This means that it does not necessarily consider all the factors a business must face. For example, increasing market share may be more expensive than the additional revenue from new sales. Because product development may take years, businesses must plan for contingencies carefully.
Since the matrix only classifies businesses as low and high, it does leave mid-sized businesses out of the mix. These companies often make up a big part of the market, so leaving them out means the business environment isn’t truly reflected.
The BCG matrix assumes that all businesses operate independently of one another. But that isn’t always necessarily true. Certain players in the market, such as dogs, may give others a boost—sometimes unintentionally.
Example of a BCG Growth Matrix
We can apply the growth matrix to many companies in the real world. Apple (AAPL) is a great candidate. Let’s take a look at the products Apple has on the market according to the matrix categories:
- Star: iPhone
- Cash Cow: Macbook
- Question Mark: Apple TV
- Dog: iPad
In 2022, the company earned $394.33 billion in net sales, of which almost $316.2 billion was attributed to its products section. The remaining $78.13 billion came from its services division.
- There’s no doubt that the majority of Apple’s sales come from its most popular product. The iPhone brought in $205.49 billion in sales for the year.3 In this case, it’s considered the company’s star.
- The cash cow for the company is its Mac products, notably the Macbook laptop, which is one of the most popular in this group. Sales for Mac products came in at $40.18 billion for the fiscal year (FY).
- One of the question marks for Apple is its Apple TV streaming service, which falls under the Services category. The competition in the streaming world is intense, with traditional services like Netflix, Hulu, and Disney+ dominating the market. But others, like YouTube and Vimeo, are also eating away at market share. In 2022, Apple’s Services division earned $78.13 billion in sales.3
- Once a darling of the company, the iPad is now considered a dog. Apple’s tablet continues to show low growth as sales continue to decline. Sales for the year came in at $29.29 billion, compared to $31.86 billion in 2021.3
What Are the Four Quadrants of the BCG Matrix?
The BCG Growth-Share Matrix uses a 2×2 grid with growth on one axis and market share on the other. Each of the four quadrants represents a specific combination of relative market share and growth:
- Low Growth, High Share: Companies should milk these cash cows for cash to reinvest elsewhere.
- High Growth, High Share: Companies should significantly invest in these stars as they have high future potential.
- High Growth, Low Share: Companies should invest in or discard these question marks, depending on their chances of becoming stars.
- Low Share, Low Growth: Companies should liquidate, divest, or reposition these pets.2
How does the BCG matrix work?
The BCG Growth-Share Matrix considers a company’s growth prospects and available market share via a 2×2 grid. By assigning each business to one of these four categories, executives can decide where to focus their resources and capital to generate the most value and where to cut their losses.2
Is the BCG matrix used in the real world?
About half of all Fortune 500 companies used the growth-share matrix, according to BCG, and it is still a key component of business school teachings today. 2
The BCG Growth-Share Matrix is a business management tool that allows companies to identify the aspects of their business that should be prioritized and which might be scrapped. By constructing a 2×2 table along the growth and market share dimensions, a company’s enterprises can be categorized into one of four classifications: stars, pets, cash cows, and question marks.
Conclusion
- The BCG growth-share matrix is a management tool used to assess a firm’s or product line’s current value.
- BCG stands for Boston Consulting Group, a well-respected management consulting firm.
- The growth-share matrix aids the company in deciding which products or units to keep, sell, or invest more in.
- The BCG growth-share matrix contains four categories: dogs, cash cows, stars, and question marks.
- The matrix helps companies decide how to prioritize their various business activities.

