

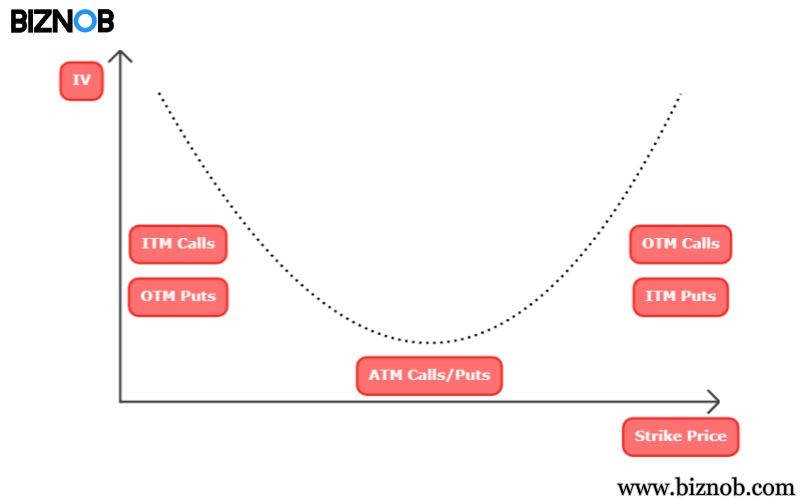
The difference in implied volatility (IV) between out-of-the-money (OTM), at-the-money (ATM), and in-the-money (ITM) options is known as the volatility skew. The volatility skew tells us whether traders and investors would write puts or calls instead. The dynamics of the market’s supply and demand for particular options and moods impact it. Traders may use relative variations in skew for an options series as a trading technique; this is also referred to as a vertical skew.
How Come Volatility Would Skew?
The discrepancy in implied volatility (IV) levels of options with various strike prices but the same expiry date causes volatility to skew. The market’s expectation for the underlying asset’s price movement is reflected in an option’s IV.
The expectations and actions of market players are the leading cause of the volatility skew. Investors may be prepared to pay more for options that benefit from a significant price movement if they anticipate it will occur in one way. A skew may result from this increased demand pushing up those options’ IV.
Additionally, investors often believe there is more upside potential in stock markets than downside risk or the danger that prices may decrease. This is because stock prices have a finite maximum value but an infinite potential for increase. Consequently, put options, which appreciate when prices decline, often fetch higher prices from investors than call options, which appreciate when prices rise. This may cause an OTM put option’s IV to increase, skewing the volatility.
Specific market events, such as economic data or corporate releases, may also cause a volatility skew. Investors may be ready to pay extra for options that might benefit from these movements if they anticipate that these occurrences will result in notable price fluctuations. A transient volatility skew that vanishes after the occurrence may result from this.
Indeed, occurrences like significant market declines or financial crises may cause skews in volatility. For instance, a significant volatility skew resulted from investors rushing to purchase put options after the 1987 stock market crisis to hedge against additional drops.
The volatility skew’s structure might provide essential details about the expectations of the market and possible future price movements. Traders and investors should remember that these are just projections and that future price movements may vary.
A modified version of the Black-Scholes option pricing model is often used to determine implied volatility levels.
How to Interpret a Volatility Skew
Understanding the effects of the skew’s shape and slope is necessary for correctly interpreting a volatility skew. The following are several interpretations of the volatility skew:
- Positive or Forward Skew: If the skew is positive, the implied volatility of OTM call options is greater than that of OTM put options. This is often seen in commodity markets, where an abrupt surge in demand may result in significant price hikes. A positive skew indicates that the market anticipates a price increase.
- Negative or Reverse Skew: If the skew is negative, the implied volatility of OTM put options is greater than that of OTM call options. This is often seen in financial markets when investors are more inclined to pay more for put options to safeguard their assets since they are more worried about price declines. A negative skew indicates that the market is pricing in a decline.
- Smile: The implied volatility forms a “smile” shape if it is more significant for both OTM call and put options than for ATM options. This is often seen in markets when there is a lot of uncertainty or if significant price swings are anticipated.
- Flat or No Skew: If there is no skew, all options have the same IV, irrespective of the strike price. This implies that the market does not anticipate significant moves in either direction.
It should be remembered that market expectations, which determine the volatility skew, are subject to alteration over time. Consequently, it’s critical that traders and investors continuously assess the skew and modify their plans as necessary. Additionally, it is advisable to utilize the skew in combination with other market indicators.
Calculating Unusual Volatility
The market’s unusual volatility may be recognized using a volatility skew. A notable shift in the volatility skew may indicate abnormal volatility. Investors may anticipate a significant price decline and higher volatility, for instance, when the skew becomes more negative and the IV of OTM put options increases in comparison to call options.
Additionally, traders and investors may determine if the present market expectations indicated in the skew are abnormal by comparing the skew to its historical values. Should the skew exhibit a significant deviation from its historical mean, it may indicate that the market anticipates unusual fluctuations.
Furthermore, a volatility smile, where the IV is more significant for OTM and ITM options than ATM options, might suggest that the market is anticipating substantial price moves in either direction. This points to unusual volatility.
It is worth noting that a high skew, or implied volatility that differs considerably across strike prices, may indicate exceptional volatility in the market.
Impact Size: “IVolatility Education: Analysis of Options Using Volatility and Other Parameters.”
The volatility skew is valuable for understanding market expectations but shouldn’t be used alone. Other elements, including economic data, market news, and even additional technical analysis techniques, should be considered when determining the possibility of abnormal volatility.
The Developing Volatility Smile
When there is a volatility smile, the IV of options on a particular underlying securities or market index rises as the options move farther into or out of the money, with ATM often being the lowest point. A V-shaped curve is often used to illustrate the pattern.
The Consequences of a Changing Smile
A volatility smile affects options pricing and expectations in the market in several significant ways. They are listed below:
- Market Expectations: The volatility smile represents what the market anticipates will happen to prices in the future. When the IV of ITM and OTM options is much greater than that of ATM options—when the grin is steep—it indicates that the market anticipates significant price changes.
- Options Pricing: Volatility may impact the cost of options. Higher IVs and higher prices will result from options with strike prices in the “wings” of the smile, or far ITM or OTM, than from options with an IV that is flat throughout all strike prices.
- Risk assessment: Information on the perceived level of risk in the market may be gleaned from the volatility smile’s shape. A sharp volatility smile might indicate a greater perceived danger of significant price changes by the market.
- Arbitrage Opportunities: Theoretically, options with the same underlying asset and various strike prices but the same expiration date should have the same IV. The volatility smile suggests that this may not be the case, which may lead to arbitrage possibilities. However, taking advantage of these possibilities is sometimes challenging because of transaction costs and other market frictions.
- Jump Risk: The market may anticipate “jump risk,” or the possibility of significant, abrupt price swigs, if there is a noticeable volatility grin. This may result from impending events like economic reports, earnings releases, or other news that might move the market.
- Limits of the Black-Scholes Model: The Black-Scholes model for options pricing, based on the assumption that volatility is constant and unaffected by the strike price, is often cited as having limits regarding a volatility smile. The volatility smile implies that there is a reality to this notion.
The Advantages and Drawbacks of Volatility Analysis
Financial market volatility analysis has several advantages, but like every study or approach, it has limits.
The Advantages of Volatility Analysis
One important indicator of risk in the financial markets is volatility. Since it implies more significant possible price fluctuations, more volatility usually translates into higher risk. Investors may use this to evaluate the risk of various assets or portfolios.
Also, investors may improve portfolio diversification by knowing how volatile certain assets are. Holding assets with varying levels of volatility and low correlation can provide diversification benefits. Volatility plays a significant role in pricing derivatives, like options. Options with more volatility often have higher pricing.
Moreover, variations in volatility might provide information about market mood. For instance, high volatility might indicate growing anxiety or uncertainty among market players. Volatility is a tool traders and investors use to guide their investing strategies. They could use straddles or strangles as techniques in a very volatile environment.
The Constraints on Volatility Analysis
Some drawbacks are the computation of volatility, its stability, the standard distribution assumption, volatility clustering, and the absence of direction in volatility analysis.
Historical volatility, which results from previous price fluctuations, might not be able to predict future volatility accurately. Although implied volatility, calculated from option prices, might provide a projection, it depends on the expectations of market players, which may not always hold.
Volatility itself may be volatile. Forecasting is challenging as it might alter quickly in reaction to market events. Also, many volatility models assume that price fluctuations have a normal distribution. Financial returns, on the other hand, often have asymmetric and fat-tailed distributions due to skewness and kurtosis.
Additionally, there is a propensity for financial markets to exhibit volatility clustering, in which periods of low volatility frequently follow periods of high volatility and vice versa. This makes analysis more difficult.
Last but not least, volatility gauges the size of price fluctuations but offers no insight into their direction. Excessive volatility may indicate significant price rises, declines, or a combination.
Implied Volatility: What Is It?
A measure called implied volatility makes an effort to quantify what the market anticipates will happen to a security’s price in the future.
What Distinctions Separate a Volatility Smile from a Volatility Skew?
Although volatility skew and volatility smile are related to the IV at various strike prices, they signify distinct market situations and expectations. The grin indicates a larger likelihood of significant price changes in either direction, while the volatility skew usually indicates a greater dread of adverse risk.
What distinguishes a forward skew from a reverse skew?
The direction of the skew is the primary distinction between a forward and a backward skew. A market expectation of a significant downward move, or a more excellent IV for lower strike prices, is reflected in a reverse skew. In contrast, a forward skew indicates a market expectation of a significant upward advance or a higher IV for higher strike prices.
When analyzing volatility, which securities are common underlying securities?
A vital component of the financial markets, volatility analysis, applies to a broad spectrum of assets. Equities, equity indexes, bonds, exchange-traded funds (ETFs), options, futures, foreign exchange (FX), and mutual funds are a few of these instruments.
Do any further methods for analyzing volatility exist?
Beyond skew and grin patterns, volatility may be examined in several ways. GARCH (Generalized Autoregressive Conditional Heteroskedasticity) models, volatility indices, volatility surface, volatility term structure, and average true range (ATR) are a few methods that may be used.
The Final Word
The insights that volatility analysis provides about market sentiment and potential price fluctuations aid in risk management and the development of trading strategies. Numerous techniques may be used to assess it, including implied volatility, volatility indexes, historical volatility, GARCH models, and more. It’s crucial to remember that none of these techniques can accurately forecast future volatility, even if they may all provide insightful information. Rather than serving as absolute forecasters of future events, they must be used as instruments to assist decision-making. One of its drawbacks is that volatility analysis depends on historical data and market sentiment, which could not be reliable indicators of future market circumstances. Furthermore, a high level of volatility may indicate increased risk, which not all investors may find acceptable.
Conclusion
- The finding that different options with the same underlying and expiry have different implied volatility ascribed to them by the market is known as volatility skew.
- Skewed stock options show implied volatility is higher for downside strikes than upside strikes.
- Convex volatility “Smile” for specific underlying assets indicates that demand for options is higher when they are out-of-the-money (OTM) or in-the-money (ITM) than when they are at-the-money (ATM).

