 Drops Due to US Inflation Concerns")
Bitcoin (BTC) lost 3.18 percent of its value on Tuesday. Bitcoin dropped 4.33 percent on Monday, ending the day at $19,310. Bitcoin’s losing skid now stands at five sessions.
BTC rose to an early high of $20,036 before going back down after a mixed day’s start.
BTC declined to a late low of $19,230 after failing to surpass the First Major Resistance Level at $20,571.
BTC fell below $19,500 towards the conclusion of the day, breaking through the First Major Support Level at $19,592. Late in the session, a stop below the Second Major Support Level at $19,242 prevented further decline.
Riskier assets suffered from market anxiety over US inflation, which is likely to prompt the Fed to raise interest rates by 75 basis points this month if US inflation picks up again. The US inflation rate for June will be released later today.
As risk aversion extended from the US equities markets, bitcoin declined along with the NASDAQ 100. The NASDAQ 100 decreased by 0.95 percent on Tuesday.
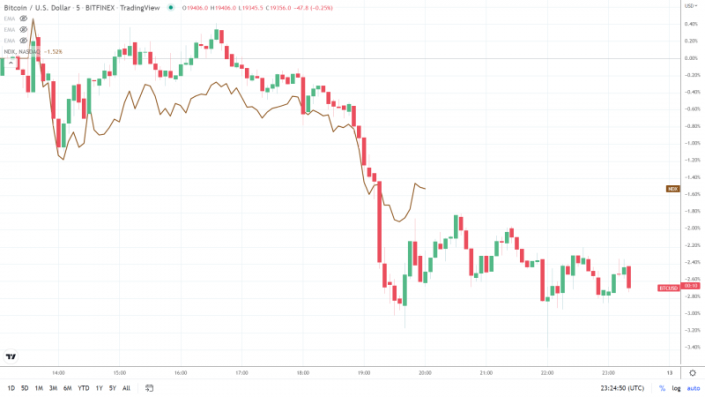
The NASDAQ 100 Mini was up 0.75 points at the time of writing.
Bitcoin Fear & Greed Index Slips back to 15/100
The Fear & Greed Index dropped from 16/100 to 15/100 this morning. The market’s anxiety regarding US inflation and Fed monetary policy kept investors on edge.
The Index reversed from a high of 24/100 in July this morning, and another rise in US inflation is expected to put sub-10/100 levels back into play.
The current year’s low of $17,601 is the target for bitcoin bearish if the price of bitcoin falls further into the “Extreme Fear” zone.

Bitcoin (BTC) Price Action
BTC was worth $19,381 at the time of writing, up 0.37 percent.
BTC began the day with a range-bound movement, dropping to an early low of $19,244 and then climbing to a high of $19,381.
Technical Indicators
To target the First Major Resistance Level (R1) at $19,822 and test resistance at the Tuesday high of $20,036, BTC has to rise past the $19,523 pivot.
In order for BTC to support a recovery to $20,000, a bullish session is required.
An protracted rally would test resistance at $21,000 as well as the Second Major Resistance Level (R2) at $20,333. At $21,137, the Third Major Resistance Level (R3) is located.
If the pivot was not moved through, the First Major Support Level (S1) at $19,016 would come into play.
BTC should avoid falling below $18,500, with the Second Major Support Level (S2) around $18,717 likely containing the downside. This is assuming a prolonged sell-off doesn’t occur.
At $17,913, the third major support level (S3) is the lowest.
It was a negative signal when seen in relation to the EMAs and the 4-hour candlestick chart (below). Bitcoin, which is presently trading at $20,433, was below the 50-day EMA this morning.

From the 100-day EMA, the 50-day EMA retreated. The price of bitcoin decreased as the 100-day EMA moved away from it.
Sub-$19,000 would become a possibility if the 50-day EMA continued to retrace from the 100-day EMA.
However, a breakthrough from R1 and the 50-day EMA to put R2 and the 100-day EMA into play would be supported by a bullish cross of the 50-day EMA through the 100-day EMA. The current value of the 100-day EMA is $20,702.
According to trend analysis, for bitcoin to reach the March 28 high of $48,192, a move through a high of $32,503 on May 30 would be necessary. If the rising trend resumes, resistance at $25,000 will likely be tested first in the near term.
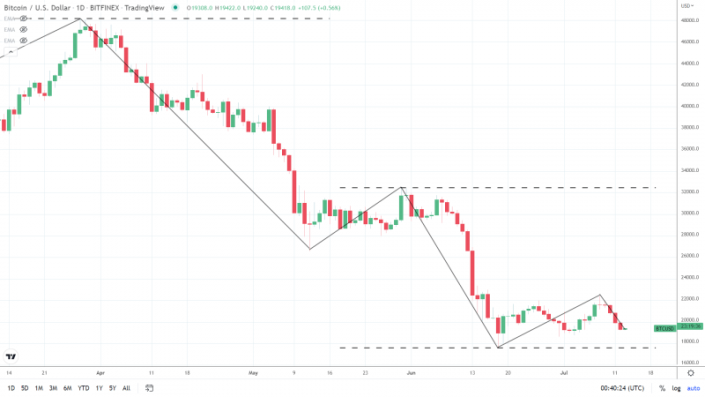
The next target for the bears would be the $17,601 low from June 18.
The original version of this article was published on FX Empire.
MORE: