
Analysts say that while things may be calmer than expected as 2021 draws to a close, the possibility of “face-melting” green candles remains.
As the end of 2021 approaches and traders prepare for the holidays, Bitcoin (BTC) starts the new week near $51,000.
Bitcoin continues to reflect on a year in which it has gone from $29,000 to $69,000 and back again, after a $50,000 Christmas.
Expectations were not for such eerie calm to end December — a blow-off top, according to the majority, should have taken the market to $100,000 and beyond by now.
Instead, after dipping to $41,800, Bitcoin appears to be ending what has been an eventful post-halving year with a slow grind through familiar territory.
With mixed emotions defining the end of Q4, Cointelegraph examines what might drive BTC price action in the final days of 2021.
“Gently does it” when it comes to Bitcoin on shorter timescales
Despite fears that low liquidity would lead to increased spot price volatility during the holiday season, Bitcoin has remained quiet, perhaps too quiet.
There were no unusual price movements over the weekend, with a brief dip below $50,000 followed by a return to the upside.
According to data from Cointelegraph Markets Pro and TradingView, $51,000 is forming a new focus at the time of writing, with limited up or down movement.
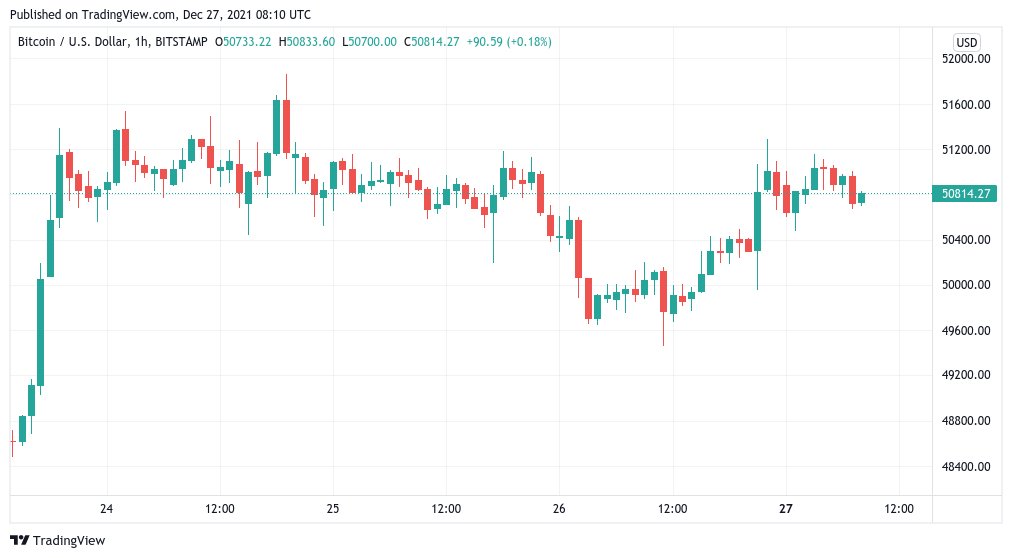
This was enough for popular Twitter trader Pentoshi to wait for the more important $53,000 zone to reappear before acting.
“Eyes on 49.2 and 53-55k per previous charts (contested territories),” he confirmed late Sunday.
On weekly timeframes, he noted the “clean” nature of BTC/USD, with the pair just above the midpoint of a multi-month range with an upper bound of $58,000 and a lower bound of $32,000.
In comments, he said that in 2022, $58,000 could be the “most defining spot” for chartists.
Filbfilb, the co-founder of trading platform Decentrader, was cautious in the short term, despite flagging multiple bullish signals on Christmas Day, warning that current BTC/USD levels could be a bull trap.
For him, a bullish trigger point for the new year would be the 50-day moving average, which is currently at $54,700.
Stock-to-flow is still fighting for another year
Despite the fact that they are under fire, the stock-to-flow Bitcoin price models — and their creator, PlanB — refuse to give up.
BTC/USD should ideally be trading above $97,000 this week, according to tracking account S2F Multiple, but reality has other ideas.
Bitcoin’s recent drop from all-time highs is testing the capabilities of a model series that has never been invalidated before.
This has sparked debate because stock-to-flow monitors price using two standard deviation bands around a key trajectory, and Bitcoin is currently in the middle of them. The model has been accused of having a too wide range of acceptable price action to be useful, despite the fact that it is far from invalid.
These were exacerbated when PlanB appeared to say that if BTC/USD did not trade at $100,000 by the end of 2021, he would abandon the models.
In early November, he wrote, “To be clear: I have no doubt whatsoever that bitcoin S2FX is correct and #bitcoin will tap $100K-288K before Dec2021.”
He later retracted those claims, emphasizing that any technical invalidation would be dictated by the standard deviation bands. As a result, stock-to-flow (S2F) and its offshoot stock-to-flow cross-asset (S2FX) are still viable options.
He countered, “Imagine thinking a model that has stayed within one standard deviation band for three years has failed.”
“We are, in my opinion, exactly where we were in March 2019, when I published the S2F model: at the low end of the first band. DYOR. Take a look at the graph. “It’s your decision.”
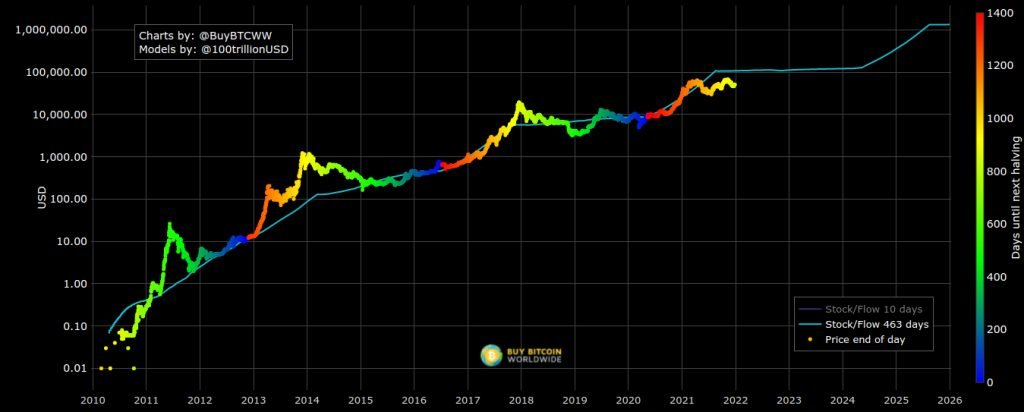
This halving cycle, S2F requires an average price of $100,000 for Bitcoin, while S2FX requires a price of $288,000 for Bitcoin.
For the first time in November, PlanB’s floor model, which had previously been accurate throughout Bitcoin’s history, failed to track the monthly close.
Watch out for the open interest time bomb
On thin holiday volumes, Bitcoin spot price action could give everyone a headache, but derivatives are a key area to keep an eye on.
Open interest in Bitcoin futures has been creeping back up since the clearing earlier this month. This is unremarkable in and of itself, but if rising open interest is combined with a falling price, Filbfilb warns, the stage is set for pain.
However, he reasoned that nuances mean the relationship between price and open interest moves is not as straightforward as it appears, but that it would “save” traders’ positions during volatile periods.
Meanwhile, fears have subsided following the $42,000 route, which flushed out excessive leverage across derivatives markets.
Despite the use of leverage since returning, funding rates have remained neutral at $50,000, a significant change from just a few weeks ago, and there is growing confidence that price gains can now be sustained.
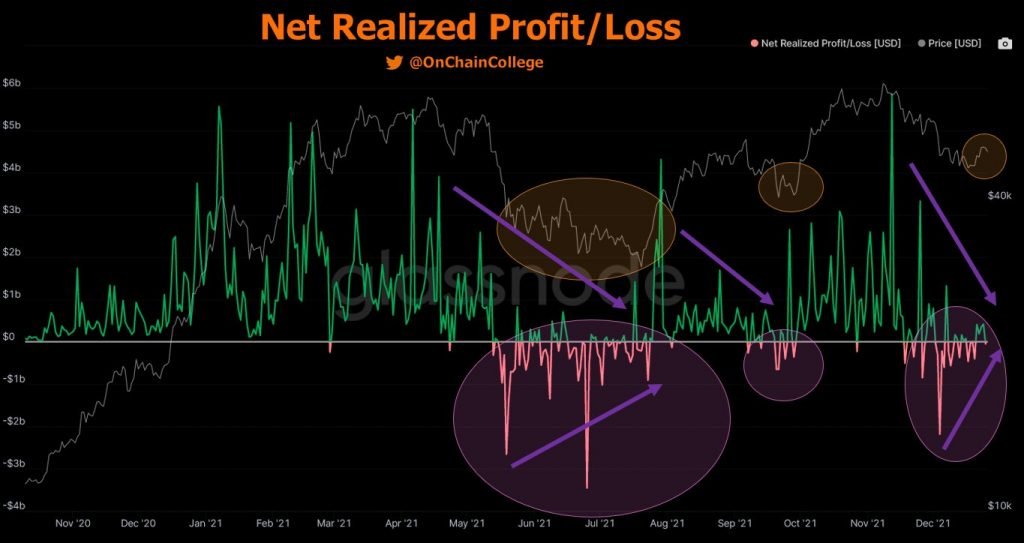
Meanwhile, on-chain indicators that govern buyer and seller behavior are indicating a possible turnaround.
“A big thing I keep an eye on is when the trend for both net realized profit and loss decreases to low levels,” tweeted On-Chain College on Sunday, citing data from Glassnode, an on-chain analytics firm.
“This tells me that sellers may be exhausted, and if buyers step in, we could see even more drastic price movement.”
The fear of liquidity spills over into macro
For the holiday break, macro markets presented a standard set of risk issues, but due to reduced liquidity, these are more likely to cause larger-than-average moves.
“Either the headline reel will spur ugly intraday moves on holiday-thinned liquidity, or volatility will remain so flatline, that if it were an ECG, the doctors and nurses would be yelling code blue,” Jeffrey Halley, senior market analyst at forex broker Oanda, was quoted as saying by Bloomberg.
With Asian stocks down Monday and European indexes looking peaky at the open, such headlines could revolve around COVID-19 or China.
In the run-up to the Christmas break, US stocks hit new all-time highs, capping a historic year in which the S&P 500 alone set 68 new highs.
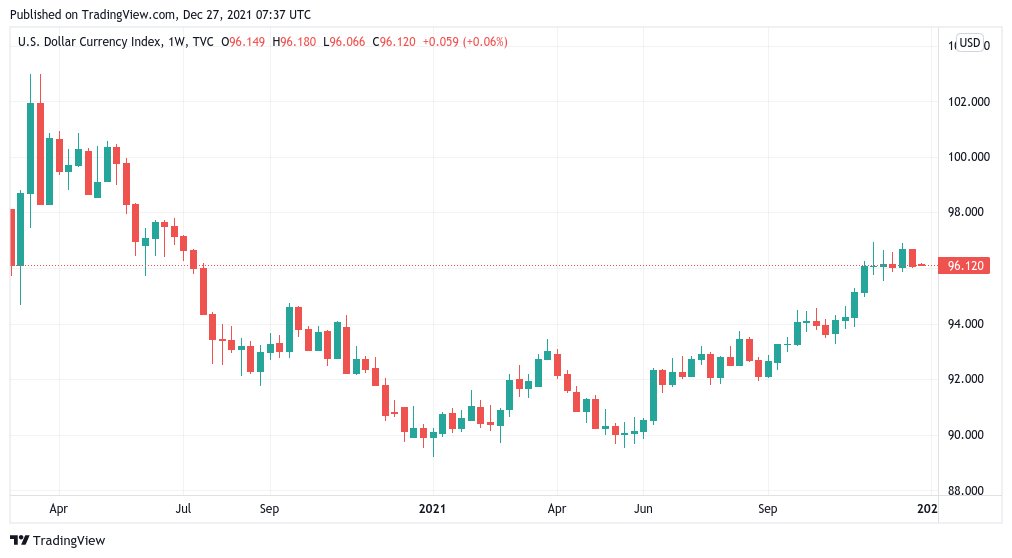
The US dollar, on the other hand, has yet to regain its previous strong uptrend, with the US dollar currency index (DXY) teetering on the edge of a bear market until the end of the year. If stocks benefit as well, this could provide some relief for Bitcoin traders.
Since June 2020, the DXY has remained near its all-time high.
“Bitcoin melts people’s faces when they least expect it”
As the year 2021 approaches, bitcoin traders are becoming increasingly fearful, not less so.
The market is far from out of the woods, according to the Crypto Fear & Greed Index, a popular sentiment gauge that factors in a variety of variables to produce an overall impression of trader emotions.
Fear & Greed is currently at 40/100, indicating “fear,” after reaching a high of 45/100 last week.
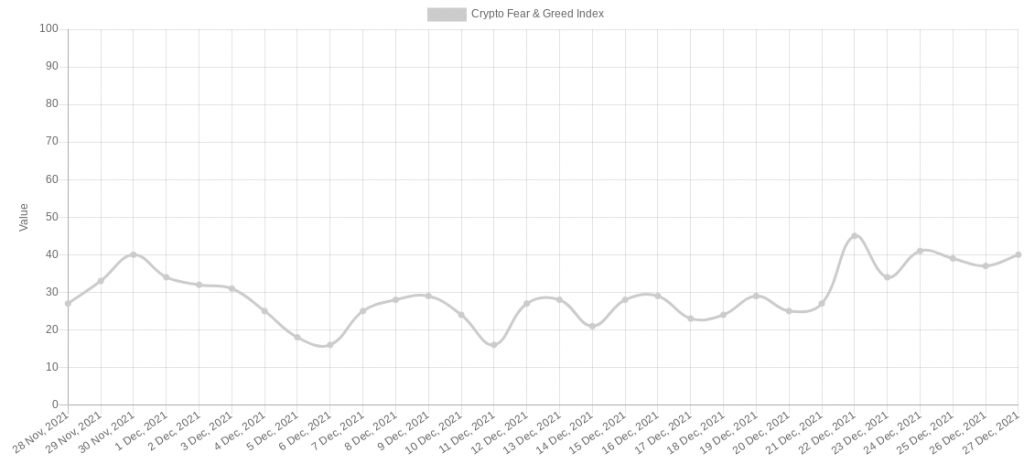
Since the rout, the Index has shown that sentiment has been particularly sensitive to even minor price fluctuations.
As a result, jitters may trigger more emotional trading reactions, and a price event may result in a snowball effect, either up or down.
A mass capitulation event, on the other hand, occurs only during periods of “extreme greed,” when the Index reaches 90/100 or higher.
Meanwhile, Blockstream chief strategy officer Samson Mow argued that most lay market participants are overly pessimistic this holiday season.
During a Twitter discussion, he said, “Bitcoin usually melts faces when people least expect it.”
Read more on: